prometheus-virtual-metrics


prometheus-virtual-metrics is a Prometheus HTTP API compatible server Python server designed to statelessly connect Grafana to almost anything by implementing simple plugins.
import math
class ExamplePlugin:
"""
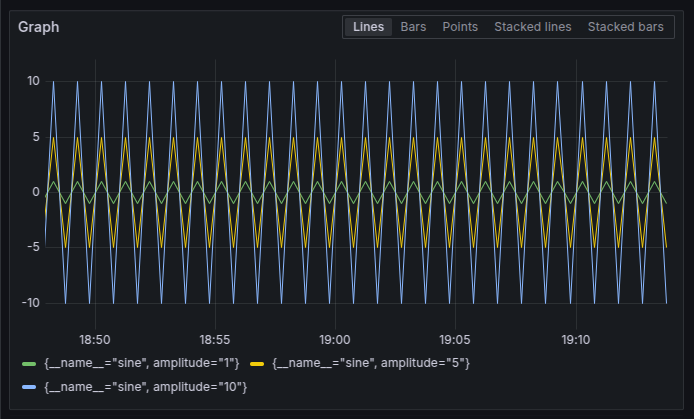
Generates a sine curve with amplitudes of 1, 5, and 10.
"""
def on_range_query_request(self, request, response):
# gets called when Grafana asks for all data in a time range
# if `sine` is not queried, we don't need to generate any data
if not request.query.name_matches('sine'):
return
# `request.timestamps` is a generator that yields all timestamps
# between `request.start` and `request.end` with an interval
# of `request.step`
for timestamp in request.timestamps:
t = timestamp.timestamp() % 60
for amplitude in (1, 5, 10):
response.add_sample(
metric_name='sine',
metric_value=math.sin(t * 2 * math.pi / 60) * amplitude,
metric_labels={
'amplitude': str(amplitude),
},
timestamp=timestamp,
)
prometheus-virtual-metrics is not meant to be a Prometheus replacement! It is intended to connect Grafana to data sources like databases or REST APIs that Grafana itself does not support.
Similar projects:
Why the integration into the Prometheus HTTP API?
prometheus-virtual-metrics is just about getting data into Grafana. Prometheus is part of the Grafana suite, so by implementing a compatible server, we get perfect integration into Grafana UI. Additionally, Prometheus defines a simple yet powerful API and query language we can take advantage of.